Utility Functions
In addition to the various analysis and visualization capabilities of InfraPy, several utility functions are also included for a variety of tasks. These include estimating arrival times for source, using fk analysis results to compute the best beam waveform and spectrum, computing the celerity for a signal from a known source, and writing waveform data from an FDSN or database source to local files. Information on the various utility functions can be summarized using, infrapy utils --help, which will print to screen the utility usage information:
Usage: infrapy utils [OPTIONS] COMMAND [ARGS]...

  infrapy utils - various utility functions for infrapy usage

Options:
  -h, --help  Show this message and exit.

Commands:
  arrival-time     Estimate the arrival time for a source-receiver pair
  arrivals2json    Convert infraGA/GeoAc arrivals to detection file
  best-beam        Compute the best beam via shift/stack
  calc-celerity    Compute the celerity for an arrival from a known source
  check-db-wvfrms  Check waveform pull from database
  write-wvfrms     Save waveforms from FDSN or database
Estimating Arrival Time Bounds
For a known source, it’s often useful to calculate the expected arrival time and bearing to determine where within a data stream to expect a signal. The
utils arrival-timefunction performs such a calculation and is useful when conducting analysis of an event of interest to focus on relevant time windows. Usage of this function can be summarized using,infrapy utils arrival-time --help. The usage summary is shown below. Note the calculation requires a source location (latitude and longitude) as well as an origin time plus either a latitude and longitude pair for the receiver. Currently a saved list of the IMS infrasound station locations is used as a reference for the--rcvroption, but in future updates that list may be expanded or an FDSN network and station search might be enabled. For now, if a non-IMS station is of interest, simply enter the known latitude and longitude.Usage: infrapy utils arrival-time [OPTIONS] Compute the range of possible arrivals times for a source-receiver pair given a range of celerity values. Can use a receiver latitude/longitude or reference from a list (currently only IMS stations) Example usage (requires InfraGA/GeoAc arrival output): infrapy utils arrival-time --src-lat 30.0 --src-lon -110.0 --src-time "2020-12-25T00:00:00" --rcvr-lat 40.0 --rcvr-lon -110.0 infrapy utils arrival-time --src-lat 30.0 --src-lon -110.0 --src-time "2020-12-25T00:00:00" --rcvr I57US Options: --src-lat TEXT Source latitude --src-lon TEXT Source longitude --src-time TEXT Source time --rcvr-lat TEXT Receiver latitude --rcvr-lon TEXT Receiver longitude --rcvr TEXT Reference IMS station (e.g., 'I53') --celerity-min FLOAT Minimum celerity --celerity-max FLOAT Maximum celerity -h, --help Show this message and exit.For a non-IMS station, expected arrival time information can be computed as:
infrapy utils arrival-time --src-lat 30.0 --src-lon -110.0 --src-time "2020-12-25T00:00:00" --rcvr-lat 40.0 --rcvr-lon -110.0
The summary of expected arrival information will be printed to screen as:
#################################
##                             ##
##      InfraPy Utilities      ##
##         arrival-time        ##
##                             ##
#################################

  Source Time: 2020-12-25T00:00:00
  Source Location: (30.0, -110.0)
  Receiver Location: (40.0, -110.0)

  Celerity Range: (0.24, 0.35)

  Propagation range: 1111.95 km
  Propagation azimuth: 0.0 degrees

  Estimated arrival back azimuth: 180.0 degrees
  Estimated arrival time range:
    2020-12-25T00:52:57
    2020-12-25T01:17:13
For a source propagating to an IMS infrasound station, simply specify the station ID information (note that the ‘I57US’ station can be referenced using just ‘I57’, so the full station ID isn’t needed, only the station number):
infrapy utils arrival-time --src-lat 30.0 --src-lon -110.0 --src-time "2020-12-25T00:00:00" --rcvr I57
#################################
##                             ##
##      InfraPy Utilities      ##
##         arrival-time        ##
##                             ##
#################################

  Source Time: 2020-12-25T00:00:00
  Source Location: (30.0, -110.0)

  User specified reference receiver: I57
  Reference IMS station match: I57US
  Receiver Location: (33.6064, -116.455)

  Celerity Range: (0.24, 0.35)

  Propagation range: 729.75 km
  Propagation azimuth: -55.01 degrees

  Estimated arrival back azimuth: 121.59 degrees
  Estimated arrival time range:
    2020-12-25T00:34:45
    2020-12-25T00:50:41
A similar utility function,
infrapy utils calc-celerity, is available that computes the celerity with specified source location and time plus arrival location and time. Usage for this utility can be summarized using the--helpoption.Usage: infrapy utils calc-celerity [OPTIONS] Compute the range of possible arrivals times for a source-receiver pair given a range of celerity values Example usage (requires InfraGA/GeoAc arrival output): infrapy utils calc-celerity --src-lat 30.0 --src-lon -110.0 --src-time "2020-12-25T00:00:00" --arrival-lat 40.0 --arrival-lon -110.0 --arrival-time "2020-12-25T01:03:50" Options: --src-lat TEXT Source latitude --src-lon TEXT Source longitude --src-time TEXT Source time --arrival-lat TEXT Arrival latitude --arrival-lon TEXT Arrival longitude --arrival-time TEXT Arrival time -h, --help Show this message and exit.
Computing the best-beam waveform
Once beamforming analysis is completed using the
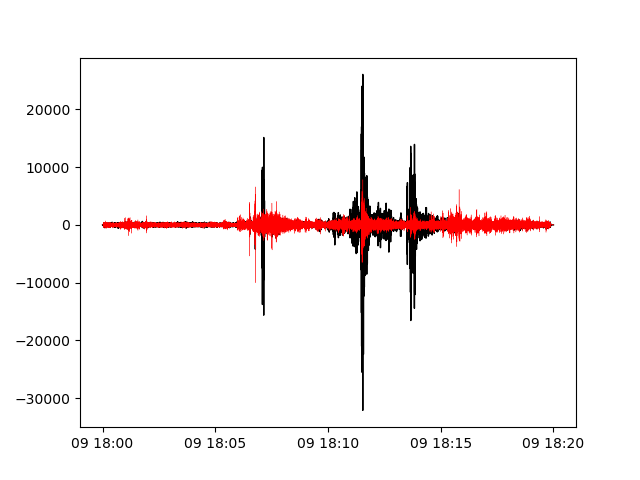
run_fkmethods, the “best beam” waveform can be computed to determine the coherent signal incident on the array of sensors. The usage summary for the best beam utility can be displayed using,infrapy utils best-beam --help. Note that the examples require runningrun_fkusing thedetection_local.configfile in order to produce the fk results file that will be used for some of the best beam calculation examples.Usage: infrapy utils best-beam [OPTIONS] Shift and stack the array data to compute the best beam. Can be run adaptively using the fk_results.dat file or along a specific beam. Example usage (requires 'infrapy run_fk --config-file config/detection_local.config' run first): infrapy utils best-beam --config-file config/detection_local.config infrapy utils best-beam --config-file config/detection_local.config --back-az -39.0 --trace-vel 358.0 infrapy utils best-beam --config-file config/detection_local.config --signal-start '2012-04-09T18:13:00' --signal-end '2012-04-09T18:15:00' Options: --config-file TEXT Configuration file --local-wvfrms TEXT Local waveform data files --fdsn TEXT FDSN source for waveform data files --db-url TEXT Database URL for waveform data files --db-site TEXT Database site table for waveform data files --db-wfdisc TEXT Database wfdisc table for waveform data files --local-latlon TEXT Array location information for local waveforms --network TEXT Network code for FDSN and database --station TEXT Station code for FDSN and database --location TEXT Location code for FDSN and database --channel TEXT Channel code for FDSN and database --starttime TEXT Start time of analysis window --endtime TEXT End time of analysis window --local-fk-label TEXT Label for local output of fk results --freq-min FLOAT Minimum frequency (default: 0.5 [Hz]) --freq-max FLOAT Maximum frequency (default: 5.0 [Hz]) --back-az FLOAT Back azimuth of user specified beam (degrees) --trace-vel FLOAT Trace velocity of user specified beam (m/s)) --signal-start TEXT Start of signal window --signal-end TEXT End of signal window --hold-figure BOOLEAN Hold figure open -h, --help Show this message and exit.The first example usage simply takes the config file and uses the default settings for the best beam. This applies an adaptive delay-and-sum analysis within each analysis window using the fk results and uses an envelope at window edges to smoothly transition between. The best beam waveform is written into a file named using the network, station, and start- and endtimes for the data with file suffix “.best-beam.dat”. The columns in this file are: [time, best-beam, residual 1, residual 2, … residual N].
infrapy utils best-beam --config-file config/detection_local.config
#################################
##                             ##
##      InfraPy Utilities      ##
##          best-beam          ##
##                             ##
#################################


Loading configuration info from: config/detection_local.config

Data parameters:
  local_wvfrms: data/YJ.BRP*.SAC
  local_latlon: None
  local_fk_label: auto

Algorithm parameters:
  freq_min: 1.0
  freq_max: 5.0
  signal_start: None
  signal_end: None

Loading local data from data/YJ.BRP*.SAC

Data summary:
YJ.BRP1..EDF    2012-04-09T18:00:00.008300Z - 2012-04-09T18:19:59.998300Z
YJ.BRP2..EDF    2012-04-09T18:00:00.008300Z - 2012-04-09T18:19:59.998300Z
YJ.BRP3..EDF    2012-04-09T18:00:00.008300Z - 2012-04-09T18:19:59.998300Z
YJ.BRP4..EDF    2012-04-09T18:00:00.008300Z - 2012-04-09T18:19:59.998300Z

Computing adaptive best beam...
    fk results file: data/YJ.BRP_2012.04.09_18.00.00-18.19.59.fk_results.dat

Writing results into data/YJ.BRP_2012.04.09_18.00.00-18.19.59.best-beam.dat
The analysis automatically creates a visualization of the best beam waveform and residuals as shown below. The black curve denotes the best beam coherent signal on the array while the red curves show the residual across each sensor. With the interactive window of the matplotlib visualization, you can zoom in and look at the various identified arrival phases to see the behavior of the residuals.
Another option in running the best beam calculation is to compute a single specific set of delays from a single back azimuth and trace velocity combination:
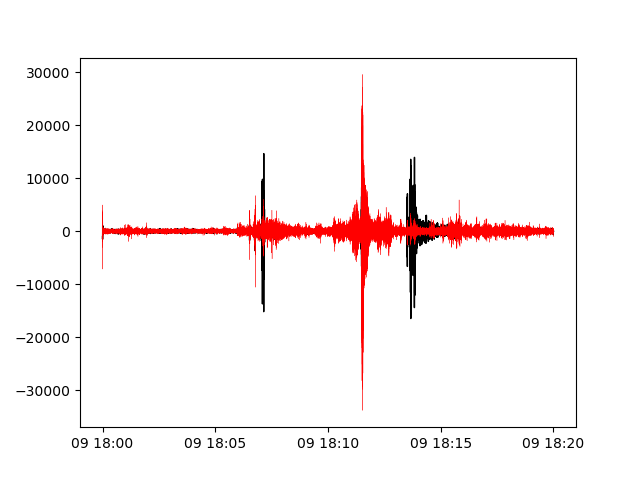
infrapy utils best-beam --config-file config/detection_local.config --back-az -39.0 --trace-vel 358.0
Note that instead of using the fk results file, this analysis applies the user specified beam parameters,
#################################
##                             ##
##      InfraPy Utilities      ##
##          best-beam          ##
##                             ##
#################################


Loading configuration info from: config/detection_local.config

Data parameters:
  local_wvfrms: data/YJ.BRP*.SAC
  local_latlon: None
  local_fk_label: auto

Algorithm parameters:
  freq_min: 1.0
  freq_max: 5.0
  signal_start: None
  signal_end: None
  back_az_step: -39.0
  trace_vel_min: 358.0

Loading local data from data/YJ.BRP*.SAC

Data summary:
YJ.BRP1..EDF    2012-04-09T18:00:00.008300Z - 2012-04-09T18:19:59.998300Z
YJ.BRP2..EDF    2012-04-09T18:00:00.008300Z - 2012-04-09T18:19:59.998300Z
YJ.BRP3..EDF    2012-04-09T18:00:00.008300Z - 2012-04-09T18:19:59.998300Z
YJ.BRP4..EDF    2012-04-09T18:00:00.008300Z - 2012-04-09T18:19:59.998300Z

Computing best beam with user specified beam...
    Back Azimuth: -39.0
    Trace Velocity: 358.0

Writing results into data/YJ.BRP_2012.04.09_18.00.00-18.19.59.best-beam.dat
The beam specified here is that for the earlier and later arrivals in the analysis window around 18:07 and 18:14. The signal at 18:12 isn’t along this beam direction and therefore the residuals remain large for this portion of the analysis window.
Lastly, for a long analysis window, a specific arrival can be windowed by specifying start and end times for the best beam signal,
infrapy utils best-beam --config-file config/detection_local.config --signal-start '2012-04-09T18:13:00' --signal-end '2012-04-09T18:15:00'
Analysis runs as above, but the data is trimmed to the specified start and end time before computing the best beam. Note that this trimming doesn’t change the file naming information.
#################################
##                             ##
##      InfraPy Utilities      ##
##          best-beam          ##
##                             ##
#################################


Loading configuration info from: config/detection_local.config

Data parameters:
  local_wvfrms: data/YJ.BRP*.SAC
  local_latlon: None
  local_fk_label: auto

Algorithm parameters:
  freq_min: 1.0
  freq_max: 5.0
  signal_start: 2012-04-09T18:13:00
  signal_end: 2012-04-09T18:15:00

Loading local data from data/YJ.BRP*.SAC

Data summary:
YJ.BRP1..EDF    2012-04-09T18:00:00.008300Z - 2012-04-09T18:19:59.998300Z
YJ.BRP2..EDF    2012-04-09T18:00:00.008300Z - 2012-04-09T18:19:59.998300Z
YJ.BRP3..EDF    2012-04-09T18:00:00.008300Z - 2012-04-09T18:19:59.998300Z
YJ.BRP4..EDF    2012-04-09T18:00:00.008300Z - 2012-04-09T18:19:59.998300Z

Trimming data to signal analysis window...
    start time: 2012-04-09T18:13:00.000000Z
    end time: 2012-04-09T18:15:00.000000Z

Computing adaptive best beam...
    fk results file: data/YJ.BRP_2012.04.09_18.00.00-18.19.59.fk_results.dat

Writing results into data/YJ.BRP_2012.04.09_18.00.00-18.19.59.best-beam.dat
The analysis focuses in on the last set of arrivals that consist of discrete pulses.

Write waveforms from an FDSN or database source
In some cases, working with data from IRIS remotely is sufficient, but in other scenarios it’s useful to simply pull waveform data and save it locally for analysis. This can be done using the
infrapy utils write-wvfrmsfunction. Usage of this function requires either an FDSN or database waveform data source and is easiest to do with a config file.Usage: infrapy utils write-wvfrms [OPTIONS] Write waveform data from an FDSN or database pull into local SAC files Example usage (detection_db.config will be unique to your database pull): infrapy utils write-wvfrms --config-file config/detection_fdsn.config Options: --config-file TEXT Configuration file --db-url TEXT Database URL for waveform data files --db-site TEXT Database site table for waveform data files --db-wfdisc TEXT Database wfdisc table for waveform data files --fdsn TEXT FDSN source for waveform data files --network TEXT Network code for FDSN and database --station TEXT Station code for FDSN and database --location TEXT Location code for FDSN and database --channel TEXT Channel code for FDSN and database --starttime TEXT Start time of analysis window --endtime TEXT End time of analysis window -h, --help Show this message and exit.
An example usage of this is to pull the I53 waveform data used in the FDSN detection example and saving them locally for analysis instead of repeatedly downloading it from IRIS:
infrapy utils write-wvfrms --config-file config/detection_fdsn.config
Data is pulled using the parameters in the config file and stored using the same network, station, and start- and endtime format into SAC files:
#################################
##                             ##
##      InfraPy Utilities      ##
##         write-wvfrms        ##
##                             ##
#################################


Loading configuration info from: config/detection_fdsn.config

Data parameters:
  fdsn: IRIS
  network: IM
  station: I53*
  location: *
  channel: *DF
  starttime: 2018-12-19T01:00:00
  endtime: 2018-12-19T03:00:00

Loading data from FDSN (IRIS)...

Data summary:
IM.I53H1..BDF   2018-12-19T01:00:00.000000Z - 2018-12-19T03:00:00.000000Z
IM.I53H2..BDF   2018-12-19T01:00:00.000000Z - 2018-12-19T03:00:00.000000Z
IM.I53H3..BDF   2018-12-19T01:00:00.000000Z - 2018-12-19T03:00:00.000000Z
IM.I53H4..BDF   2018-12-19T01:00:00.000000Z - 2018-12-19T03:00:00.000000Z
IM.I53H5..BDF   2018-12-19T01:00:00.000000Z - 2018-12-19T03:00:00.000000Z
IM.I53H6..BDF   2018-12-19T01:00:00.000000Z - 2018-12-19T03:00:00.000000Z
IM.I53H7..BDF   2018-12-19T01:00:00.000000Z - 2018-12-19T03:00:00.000000Z
IM.I53H8..BDF   2018-12-19T01:00:00.000000Z - 2018-12-19T03:00:00.000000Z

Writing waveform data to local SAC files...
A similar function is available for interfacing with a database using pisces,
infrapy utils check-db-wvfrms. This function checks what waveform and station information is pulled from a database source and is a useful data check before running further analysis.
Other Utility Functions
- A utility function is available to create synthetic detections from propagation modeling results in InfraGA/GeoAc,
infrapy utils arrivals2json. This function takes an […].arrivals.dat file from InfraGA/GeoAc’s eigenray analysis and creates a detection file from the arrival information. - As database interfacing is more fully established using pisces, utility functions will be implemented to enable related tasks. Currently planned functions include methods to write/read detection and event information between […].dets.json files and a database. The
run_fdandrun_fkdmethods are likely going to stay the same producing detection files after analysis and a utility function will be used to write detection info to a database. Similarly, one might specify a latitude/longitude box and start/end time bounds to pull all detections from the database into a .dets.json file for event identification, localization, and characterization analyses. - As work is done and feedback is provided to the InfraPy authors, additional utility functions are being considered and implemented. If you find have a utility function that would be useful to have included here, sent information to the authors or submit your idea on the github repo.